Thursday, July 28, 2011

New range?

CNIT 7/28/11 EOD: $2.20
+0.11 (5.27%)

Today CNIT recovered a portion of what it lost yesterday, taking advantage of a short lived rally until mid-day and experiencing extremely low volume in the afternoon (including few sellers, as it held near the HOD).

Aside from huge selling that may occur if there is a general market sell-off, we may see CNIT experience a new range, which will probably be in the $1.90 to $2.20 range. If the market is weak, I could see the range forming around $1.85 to $2.05, where the stock remained for the majority of June.


You can see from the previous chart that consolidation previously occurred around this range, and a fair amount of support was seen around the $1.85 area (even in the first major sell-off at the end of May, it took a lot of effort from sellers to breach that range). In addition, the 50dma, which is now at $2.18, will likely be a new resistance area for the stock. As the 50dma continues to go down (if CNIT doesn't break out upwards), it will then be the line to cross on volume in order to start a new upward trend.

Wednesday, July 27, 2011

Change in daily coverage

CNIT 7/27/2011 EOD: $2.09
-0.15 (-6.70%)

Alright, well today was a pretty tumultuous day for the markets, presumably because people are freaking out about what might come from the debt ceiling deadline next Tuesday. It hurt all equities. Everyone suffered, favorites AAPL and GLD included. CNIT and other small caps, of course, took a severe beating, and CNIT ended at a measly $2.09, with an AH price of $2.05. As I mentioned in an earlier post, I took the cautious route this morning and converted my assets to 80% cash. This included my CNIT position, which is now only about a fifth of what it was before. I did this because I anticipate that, at least for a few weeks, things won't be as rosy as they've been for the past month or so.

I'm also going to be changing the way I cover CNIT from now on. Instead of doing "forced" daily updates, I will post updates when something significant has occurred, or when there is a particular technical indicator I feel needs to be shared. In other words, if one day there is really not much to learn, I may not post the price/change, etc.

Cash

With the mess happening today, and the mess that's bound to keep happening for a non-negligible number of sessions in the next few weeks, I've decided early this morning to exchange a large portion of my equity for cash. I've increased my cash position from about 20% to about 80%, and so far today have been happy with the decision.

I haven't lost hope in CNIT, or in equities in general, but feel like there's some turbulence ahead and that we should brace ourselves. I could be wrong. The retarded debt ceiling talks could turn out to make investors feel confident (not sure how) and make the stock market go up. I have a feeling the unease and general anxiety, however, will be too much to bear.

I'll be looking for stocks to grab at discount prices in the next 2-3 weeks.

Tuesday, July 26, 2011

7/26/11: $2.24

-0.04 (-1.75%)

74,491 shares traded! That's pretty lame.

Don't have much time so I won't go into a lot of detail, but for those who paid attention today, CNIT hit $2.21 again and came back to $2.25. I'd wager tomorrow will at least see $2.30-$2.31 for a little bit, regardless of where it ends up. You know what that means. Daytrade the range. Not to mention if you had bought in yesterday at $2.19-$2.21 you could have sold today around $2.30. That's what I did. Temporary downtrend doesn't mean you can't be money long.

Monday, July 25, 2011

Preparing for Q2 earnings on 8/1

CNIT will be reporting Q2 earnings next Monday on August 10 (updated). The consensus estimates calls for earnings of $0.17 per share.

(click for a closer look; this chart courtesy of TD Ameritrade)

I took a look at past earnings to see what the response was each day (and +1 day). I looked at everything fromt FY08 Q2 to FY11 Q1 (12 periods) and here's what I found:
  • CNIT has beaten the street on a Q2 earnings release 100% of the time in the past 3 fiscal years, beating by an average of 13.44%
  • CNIT beat estimates 9 out of 12 times, and the average beat was 13.67%
  • CNIT failed to meet estimates 3 out of 12 times, and the average miss was -14.39%
  • Only 4 out of 12 times did the stock close higher on the day of the earnings release, gaining an average of 2.61%
  • The stock closed lower on the day of earnings 7 out of 12 times, losing an average of -10.05%
  • The stock closed at the same price 1 out of 12 times (FY08 Q2)
  • On the day after earnings, the stock closed higher than on the close of the day before earnings 4 times, gaining an average of 3.59%
  • On the day after earnings, the stock closed lower than on the close of the day before earnings 8 times, losing an average of -7.15%
  • In the last 4 earnings releases, the stock ended up down each time, despite beating estimates 3 out of 4 times
  • Volume has consistently been quite high during the day of earnings (+/-1), with generally 2-4x the # of shares traded than the average for the period
  • The HOD on the day of earnings is an average 6% above the close on the day before earnings, and has only been below the previous day's close 3 out of 12 times; this indicates there might be an opportunity to sell at a high before an eventual general sell-off occurs
The data, as you can see, isn't particularly rosy. Despite being generally pretty good about beating the street, CNIT has frequently taken a beating during and after earnings. Note also, however, that this year's estimates call for a decline in EPS YoY ($0.19 last year vs. estimates of $0.17 this year). In addition, CNIT indicated in this 7/15 press release that they had secured new contract wins of over $30.4M in Q2 2011, adding that they had experienced "some weakness in terms of signing new contracts...".

7/25/11: $2.28

-0.03 (-1.30%)

Another fairly uneventful day for CNIT, with volume just under 130k. The 50dma is now at $2.21 so we're still a little above. It is clearly acting as the major support area, with the stock once again today dropping briefly to that range ($2.19 to be precise) and recovering within about an hour (on great volume I might add). Here's today's chart (note the early drop, which CNIT's been doing a lot recently, and the high volume as it shot back up to around $2.30).


Since the stock's dwindled a fair bit in the past few weeks, I decided to revisit some fundamentals to ensure I still felt good about it in the long term. Here are some data points (obtained from finviz.com):
  • P/E: 3.30 & Forward P/E: 2.40 - with extremely low price-to-earnings and forward price-to-earnings ratios, this is clearly still a good value investment play.
  • Profit margin: ~22% - not only is this small company making money and growing, but it's posting an impressive profit margin as well.
  • Insider Ownership: 38.87% & Institutional Ownership: 34.46% - when investing in small caps, it's important to make sure that (a) insiders are invested in the company's success (i.e.: they have skin in the game to make sure it succeeds), and (b) institutions show support for the stock. This insider ownership is a very good sign (it's primarily all from the CEO, Lin Jiang Huai, however, who holds over 20M shares). The institutional ownership number is fairly good too, and according to finviz is rising (I'm waiting for detailed institutional ownership data from Nasdaq to see how much actually changed, though, and who the institutions are).
  • Price Target: $9.00 - ok so this is probably not the most reliable data point, but it's worth nothing that the one analyst that does have a price target on CNIT is very bullish for the stock, as $9.00 would indicate nearly 300% upside on the current price.

Friday, July 22, 2011

7/22/11: $2.31

-0.05 (-2.12%)

CNIT ended today's session roughly where it started the week, and with similar action (volume <150k). Today reconfirmed that the $2.30-$2.37 trading range is an opportunity for some small day trading profits, though with the low volume some of the spreads aren't very favorable.

Thursday, July 21, 2011

7/21/11: $2.36

-0.01 (-0.42%)

Another fairly uneventful day for CNIT, with volume just over 100k. It's continuing to look like $2.30-$2.31 is a pretty good day trading support, with $2.36-$2.37 as a resistance for a quick 2-3% gain. After hours there was a very small buy at $2.40, helping the stock get a little gain AH, but not significant given the extremely small number of shares traded.

Instead of talking about CNIT, therefore, I'll mention a few other names that are getting some good action and that you should take a look at if you're interested in Chinese small caps with great fundamentals and lots of upward potential.

ZST Digital Networks, INC. (NASDAQ:ZSTN) supplies digital and optical network equipment to system operators. They currently have a P/E that hovers around 1.44 as it has plummeted from its 52 week high of $8.48. Since early June, the stock was trading between $2.30 and $2.75, and in the last week it has recouped to trade between $3.10 and $3.30 in the last two days, with exceptional volume yesterday (7x the average trading volume). With great fundamentals (including excellent EPS growth and no debt), ZSTN might be back in an upward trend. Rodman & Renshaw last rated ZSTN "Outperform" on 5/5/11 with a target set at $14.


SinoHub, Inc. (AMEX:SIHI) sells custom design, private-label mobile phones through distributors and operators in developing countries. Their partners include Samsung on the manufacturing side and China Mobile on the operator side. Note that China Mobile is the largest mobile operator in the world by number of subscribers, and that China represents the largest number of mobile device buyers as well as the largest growth for new buyers in the entire world. SIHI has a P/E currently around 2.01, great EPS growth (78%), and their auditor is Baker Tilly (so less to worry about for those of you who still don't trust small Chinese companies). Today SIHI surged 11.20% and in the past week rose more than double that, coming up from $1.15 to $1.39. Volume today was huge compared to the average (6x), and there was even AH interest that drove the stock up to $1.50. SIHI has retraced from a 52 week high of $3.30, and Rodman & Renshaw have given it a $5.50 price target on an "Outperform" rating on 5/17/11. With the recent surge SIHI looks like a great chart that could easily see $2 in the next few weeks.

Wednesday, July 20, 2011

7/20/11: $2.37

+0.04 (1.72%)

Nothing miraculous about today's chart and action. The volume was so low and the spreads so high that the price movements aren't very significant. There was a little bit of interest late in the day which is always a pretty decent sign, and CNIT did close on the HOD, but again the lack of volume doesn't make me think very much of today's session.

A few other Chinese small caps I'm following *did* have a great day today, in particular ZSTN (+13.10%).

Tuesday, July 19, 2011

7/19/11: $2.33

+0.04 (1.75%)

And we're back to $2.33 today with CNIT. A pretty obvious range seems to be forming, with the stock trading between $2.20 and $2.35, occasionally going $0.05 further in one direction or the other. This has been the case for the past three sessions and, given CNIT's history, I wouldn't be surprised if it lasted a few weeks, especially if volume remains around 150-300k. That said, knowing this gives us an opportunity to make some pretty tidy earnings. For my part I continued yesterday and today with limit buys at $2.25 and limit sells at $2.32 and $2.35. I'm setting up some more orders for the next few days.

One positive sign today was that, besides a very brief open in the red, the stock traded in the green all day long. I suspect there are some machines selling at $2.37-$2.38 given that every attempt to give the stock some momentum is shortly met with sellers at that level.

Monday, July 18, 2011

7/18/11: $2.29

-0.08 (-3.38%)

Dropping early in the first couple of hours of trading today as it has done in the past few sessions, CNIT only partially recovered from its LOD of $2.23. Anticipating a small rebound around the 50dma, I bought some more shares at $2.25 and was rewarded with a quick sell at $2.30. I grabbed a few more when CNIT hit $2.25 again expecting a small rise late in the day as CNIT has done multiple times in the last week.

Today the markets were quite weak, with the media pointing to US debt talks as the major reason we ain't partying (read: rallying further). That said, AAPL and other large cap tech stocks are having a terrific earnings season so far. If the market, alongside these great earnings, can begin to rebound, we might see some collateral goodness hit CNIT.

A few technicals are playing in favor of CNIT at this time. The weekly and monthly RSIs are moderately oversold (in the 30s), the 50dma is acting as support, and last Friday's hammer is still a positive indicator that buyers are interested in keeping this stock afloat and taking advantage of dips to buy more shares.

In terms of volume, there was nothing glorious about today, as the number of shares traded came in under Friday's session.

There wasn't a lot of noise in the media either today, though Zacks Investment Research did call out CNIT in a report about IT companies with high gross margins (see here).

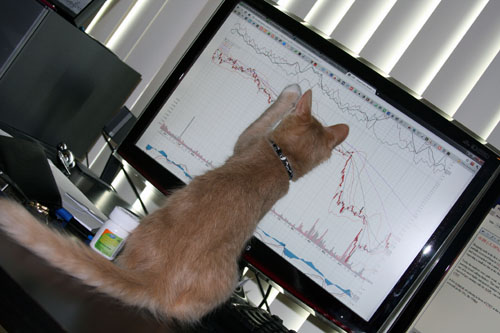
On a related note, I've been training one of my cats, Tofu, to trade CNIT. See here...


In the picture he's pointing to the high back in October and saying we're headed back there. Enough said :)

Sunday, July 17, 2011

Hammer on 7/15

I forgot to mention this on Friday, but the daily action actually produced a fairly interesting hammer candlestick that could be read as a bullish indicator for the week to come.


After a decline (like we've seen in the 5 sessions prior to Friday 7/15), a hammer can signal a bullish revival. The shadow at the bottom indicates that sellers drove prices down during the session but that buyers took control in the end.

I'm not an expert on candlestick reading, so I did a little research. Typically a hammer requires other favorable technical indicators in order to be trusted by technical traders. In addition, expanding volume is usually needed to determine if this is really a meaningful indicator. In terms of volume, we did see slightly higher volume than in the past 4 sessions, but not so big as to be really trusted. Therefore in order for this bullish reversal to be confirmed we'd like to see some more bullish action on the first session that follows (i.e.: Monday), such as a gap up or long white candlestick.

Media coverage

CNIT has appeared a couple of times in the media in the past few days:

Aside from that they have been getting some media attention for their press release the other day, which I mentioned in an earlier post.

Friday, July 15, 2011

7/15/11: $2.37

+0.07 (3.04%)

CNIT was officially headfake central today. It's up! It's down! It's back up!

Starting the day with a short-lived rise to up to $2.39, the day started off well. There was volume. The market was feeling bullish. However a surge of sellers came in at around 10:22am to sink CNIT down to as low as $2.17. On its way down, I of course grabbed a couple more shares and set some limit sell orders a few clicks up. I then got a few more hours of sleep (I'm on the west coast) and woke up comfortably around 8:45am PST (11:45 EST) just as CNIT started to go back in bull mode. Volume wasn't huge, but there were enough buyers to get the stock back up to around $2.33 and hit my limit orders for a quick profit.

Again, volume wasn't great today but at least the recovery is a good sign, and in fact volume has been increasing slowly over the past couple of days. The key challenge with volume for this particular stock, and the reason I keep bringing it up, is because there are still a fair number of short sellers out there trying to keep CNIT down, and the days-to-cover ratio is significantly higher if there isn't reasonable volume keeping the stock up, which can encourage short sellers to keep doing what they do, which in this case is try to keep a good company down.

Let's look at today's very fun chart.


Just over 300k shares were traded today, with about 10% in that 10:22am spike that sent the stock downward. As of close, CNIT is still holding above the 50 dma which stands at $2.25.

Some technical indicators to pay attention to:
  • On the ADX chart, there is an potentially imminent bearish ADX-line cross-over by the +DI. No way to know if this will keep the stock down, though looking at past activity after the large upward push back in October, it could turn into a period of consolidation around a range that would probably be in the $2.20-$2.40.
  • The daily RSI is now at 54, just above the centerline at 50, and saw a small bounce today.
"SHENZHEN, China, July 15, 2011 /PRNewswire-Asia-FirstCall/ -- China Information Technology, Inc. (Nasdaq: CNIT), a leading provider of information technologies and display technologies based in China, today announced that it signed $30.4 million in new contracts during the second quarter of 2011. The Company's core IT business segment contributed 65%, or $19.8 million, of the total contract wins, while its Digital Display segment contributed 35%, or $10.6 million."

They do also add a statement about relative weakness in terms of signing new contracts. However, looking at the 10-Q for the same period last year, we see that total revenue amounted to $33.5M. I'm assuming that the new contract revenue they refer to in this press release don't account for total revenue for the quarter (recurring contracts?). I expect we'll still see some growth, and given what they say in the press release might see margins go up as well ("...efforts towards improving the quality of our earnings"). We shall see.

Have a great weekend!

Thursday, July 14, 2011

7/14/11: $2.30

-0.13 (-5.35%)


Another disappointing session for CNIT today, though most likely in part attributed to continuing weakness and profit taking in the general markets. Up a little early in the day, the stock tumbled past the open price at first, and then after struggling a little at around $2.35 failed to hold that level and ultimately got pinned at $2.30.

On the sort of bright side, the stock did seem to find some support at the 50-day moving average, which now hovers around $2.26.


Remember that the break through the 50 dma was a critical upward point for CNIT, which had long found resistance there (see the failed break attempts in May which got blocked by the blue 50 dma line above). This is therefore a critical line to watch, and will likely determine if CNIT will experience a bounce or fall back to the $1.90-$2.10 range. I'm guessing we'll stay around the 50 dma for at least a session or two, and if we don't the move is likely to be big, whether it's up (knocking on wood here) or down.

In terms of daily activity, I promised myself yesterday based on my analysis that I would sell some of my core position in the mid to high $2.40s, but failed to do so in the morning. I also promised myself I wouldn't buy more at lower levels, but went against the plan, out on a limb, and decided to play the support area. Therefore I bought some more shares at $2.30 and $2.35. Again, this could be a very good or a very bad idea.

7/13/11: $2.43

-0.03 (-1.22%)

After being up to $2.55 early in the day, CNIT had very low activity and declined to $2.43 by the close of the session. Today was disappointing because of the failed lift as well as the continued low volume. This now spells 4 consecutive poor sessions for CNIT.

I continue to believe that CNIT is suffering more than its share of pain due to macroeconomic factors that are troubling investors and traders alike. With a current P/E of ~3.50 and bright expectations for growth, CNIT is still a rock solid pick. However, technicals aren't in its favor right now and without a considerable volume of buyers the stock will continue to lag or suffer more.

Today I sold a 7,500 lot for $2.52 which I had bought yesterday at $2.48. This was partly for a quick win and partly because I felt the stock wouldn't hold up for the entire session.

In after hours, some shares were sold at $2.38, indicating CNIT may open in the red tomorrow. That said, the after hours volume was low and may not be reflected in the regular session (perhaps only the opening minutes?).

Unless volume picks up tomorrow I may continue to unload more shares.

Tuesday, July 12, 2011

7/12/11: $2.46

+0.01 (0.41%)


Today was a fairly uneventful day. CNIT was slightly down in the morning and came back up to its opening price of $2.45, before teasing $2.50 and promptly returning to $2.45. With only slightly over 100k shares traded today, we can't say very much about the stock based on this session's action, except that there was little interest from either sellers or buyers. This may be, in part, because it's earnings season and there are many other stocks in focus for traders these days.

Monday, July 11, 2011

7/11/11: $2.45

-0.17 (-6.49%)


Today was another rough day for the markets in general, and for CNIT in particular. Dropping early in the day, CNIT went as low as $2.40 and only recovered to $2.45, struggling all day due to very low volume.

The volume, going just under 240k for the day, is well below the recent daily average and is a serious red flag for the stock. Without demand, clearly CNIT can't continue to move up and profit takers as well as short sellers will drive the stock down.

Today one of my limit buy orders was hit at $2.48. I have another at $2.35 but continued weakness in the overall market is making me reconsider whether continued buying is the right play, as in the next few sessions CNIT could continue to go lower.

On a completely separate note, I adopted two kittens yesterday so have been very busy taking care of them...

Danger!

This morning, it seems like pretty much everything is suffering. CNIT, however, is suffering more, being down about 8% in the first few minutes of trading. Let's see how it developers, but this could spell some short term danger for CNIT.

Friday, July 8, 2011

7/8/11: $2.62

-0.20 (-7.09%)


Today CNIT saw a pretty tough correction with some positives and some flags. It was, however, very educational

During today's session I made a few exchanges on CNIT, particularly as I started to see some intraday support and resistance levels. I have a couple of limit buy orders that executed early in the day at $2.68 and $2.55. In hindsight the $2.68 level in particular wasn't very clever, because besides a very brief rebound at this price on 7/7, there was no evidence that this was a support area. $2.48 was a good buy and my only regret is that I didn't buy more at that level. All in all, however, 2 of my intraday plays worked out, as I made 2.82% on one ($2.48 to $2.55) and 2.75% on the other ($2.55 to $2.62). My other intended intraday buy at $2.68 will have to stay put over the weekend, so my position right now is about 7,500 shares larger than I would ideally like it to be.

Here are some positive things to note about today's session:

  • The overall market was down, so a correction on CNIT wasn't too surprising given a variety of factors (e.g.: the RSI looking overbought, the resistance at the 100dma, speculation about vulturing shortsellers, etc.).
  • After being over 14% down, CNIT rebounded to end down just 7.09%. Ok, so a 7% loss is nothing to be happy about, but since the stock experienced two double digit growth days this week, we can cut it a little slack.
  • No news is...good news? It's pretty clear that the sell-off was mostly about profit taking and technicals and wasn't led by any particular news. Fundamentally, the stock is still as strong as it was 2 days ago.
Action today can teach us how to play the range over the next few days/weeks. My guess, if I was a betting man, would be that, as I've mentioned in an earlier post, CNIT will fluctuate between $2.50 and $2.80 (conservatively) and $2.30 and $3.00. With that in mind, it's good to know if there are any particular levels that seem to show support or resistance from an intraday perspective. Specifically, from today's action, we can guess that $2.60 is a pretty strong pin which can act as either support or resistance, and $2.48 is a fairly strong level of support. I have a limit buy order at $2.48 as well as a few at lower levels.

Here are some flags that could bring some concern about CNIT in the short term:

  • Volume today was low (~500k shares). Yesterday I mentioned that the volume was lower than the previous day, and said this was a bad thing. If you look at CNIT historically, as well as other small cap stocks, they are particularly vulnerable to losing momentum when their gains come with lower volume (i.e.: less interest / speculation that a correction is coming).
  • The Wilder's DMI (ADX) (one of my favorite indicators) saw a crossover of the +DI line over the -DI line and then the ADX line a few days ago - a very bullish indicator which was seen back in October 2010 just prior to CNIT's run up from the mid $4s to the low $6s. Today, the +DI started reversing downward sharply, and if it crosses back over the ADX line is could be short term bearish for the stock.

Again, there was no particular news of interest today so the only thing to look forward to on Monday is to see if the market continues to decline and perhaps take some victims with it, and for CNIT specifically if technicals continue to drive a downward correction or if a range begins to establish itself as previously noted.

As usual, I would very much appreciate any feedback or comments, particularly if they are meant to correct or improve my analysis.

Have a great weekend!

Morning action

CNIT, as expected by some, is taking a "rest" so far today. It was down significantly, going all the way to $2.45, before experiencing a short bounce that saw it go back to $2.65, midrange between open and LOD.

I took this opportunity to buy extra lots at several points, some of which I've already sold for a quick profit. More details on that later.

This morning was also very educational, particularly in terms of defining some potential midday resistance and support areas if CNIT does trade within a range for next ___ sessions. I commented on 7/6 that the new range would be roughly $2.50-2.80, with major support at around $2.30 and major resistance at around $3. With that in mind, I have a couple more limit buy orders set between $2.30 and $2.50. The action this morning can help decide more specifically where to set these limits.

Thursday, July 7, 2011

Daily analysis

Here are a few positive signs as well as some risks based on today's action.

The good stuff:

  • Volume today was 1.12M, which is again quite a bit higher than the daily average. This not only puts pressure on short sellers (as mentioned in an earlier post) but also confirms the interest that traders and investors have in the stock. For there to be a continuation in the growth CNIT has experienced in the past few days, volume is key.
  • The stock ended at the high of the day ($2.82). This is a very bullish flag, and may very well carry over into tomorrow's session. Let's not get too excited, however, as it's not like it carried into after-hours. Note, however, that with this kind of stock the spread during AH trading is usually pretty wide, which means AH trading is considerably less common than with more liquid stocks.
  • After being pinned at $2.73-2.75 for most of the day, the stock moved up rather than down. After this period of consolidation, it could easily have experienced a small sell-off to retest a lower range.
  • The 100dma is very close (currently at $2.89). This means if there's continued strength in CNIT in the next couple of sessions (or maybe even tomorrow), we could see it break past this. Note however that the 100dma, combined with the high $2s / low $3s where it traded for 1.5-2 months in April/May should be an area of non-trivial resistance for CNIT.
  • The 50dma is close to reversing upwards. Today was the first day in a long time for CNIT that the 50dma did not drop (stayed at $2.27), which is of course due to the 7 consecutive positive sessions it has had. This is important because with continued strength it should eventually cross over the 100dma which would be a great bullish technical indicator.


Here are some potential risks to consider:
  • The RSI for the stock (Wilder's) has now been in "overbought" (>70) territory for 2 days. It's only slightly above 70, and also note that it can stay here for quite a few session (and go higher) as the stock continues to build strength before stabilizing or correcting. Still, however, it's something to note.


  • The volume, while above average, was slightly lower than yesterday (see the 1st chart). It's not significantly lower so I don't think this is a really bad sign, but typically we'd like to see continuation with increasing volume for the rapid uptrend to continue.
Ok, well that's it for now. I'm excited to see what direction the markets will take tomorrow!

7/7/11: $2.82

+0.15 (5.62%)


While CNIT was pretty much pinned at $2.73-$2.75 for most of the day, we saw a fairy tail ending with a rise to $2.82, the HOD, about 15 minutes before the market closed. Ending on the HOD is a particularly strong sign and I am excited to see if the stock can continue tomorrow to end the week on a strong note. There are both positive and negative signs to take a look at however. I don't have time right now so will post the analysis later on.

With regards to activity, I bough an extra 5k shares at $2.75. It could be a very good, or a very bad, move. The reason I made the buy was because I felt that, being pinned up 2-3% at ~$2.75, the stock was showing some strength and positive consolidation. Early on, when the stock dipped to the opening price of $2.67 at 9:52am, it quickly bounced back to $2.75. Initially I had a limit buy at $2.67 (and still do, as well as several at lower levels), but I decided there was some strength in the stock that could propel it higher before it would retest lower levels. The end of the day helped reinforce that strategy, though the real test will be tomorrow.

Are short sellers an issue?

So far today, CNIT is holding up reasonably well. Monitoring it today, I came across an article that claimed that CNIT, among a few other recent big gainers, raises "red flags". The only thing it has against CNIT is that, as with other stocks that obtained their US listings through reverse mergers, it has over the past few months been the target for lots of short sellers. I will look into how I feel about reverse mergers later, but for now let's evaluate the risk posed by short sellers on CNIT, with data rather than feeling.

The chart below, obtained using data from Nasdaq, shows CNIT short interest (in # of shares) vs. average daily volume for the corresponding period.


And this next graph shows the short interest ratio (or "days-to-cover ratio"), shows the short interest divided by the average daily volume. The short interest ratio tells us how many days it takes for short sellers to cover their position if it gains strength. The lower, the better for bulls and anyone who's long.


What's interesting is that, pretty much for an entire year, the short interest on the stock has been declining (graph 1). However, because volume wasn't picking up, the short ratio continued to have spikes in late 2010, and stayed pretty solid up until March. Then suddenly volume picked up and while short interest wasn't declining any faster, the short sellers needed to cover their positions much fast.

Finally, we see what happened in late May with a sudden massive surge of short sellers coming in to feed on perceived negative news. This quickly changed when buyers came back in and everyone realized that bad news wasn't all that bad. Now we're at a point where the short ratio is 1.25 and falling, and volume has been increasing comfortably.

I'm guessing once we have data for July, given the increase in volume and bullish trend reversals, that we'll see average daily share volume surpass short interest, causing the short interest ratio to dip under 1.

It remains to be seen whether there will be another surge of short sellers, but the trend so far is positive for CNIT.

Wednesday, July 6, 2011

MACD centerline crossover

Just noticed that on today's daily chart CNIT experienced a centerline crossover for the MACD(12,26). Yet another bullish indicator.

7/6/11: $2.67

+0.29 (12.18%)


Yet another fantastic session for CNIT. I really feel like I started this blog at just the right time (7/1), right before this pretty little stock started popping. Today I kept my core position intact (23k shares) and sold the 5k I bought yesterday for a +$0.21 (+9.3%) gain. I had the sell order for that lot at $2.48 because I felt that it would be an area of resistance. In hindsight I could have kept longer, but then again 9.3% in one day isn't bad...

The chart below was made using www.FreeStockCharts.com, a fantastic in-browser Silverlight application that let's you do charting for free. I highly, highly recommend checking it out. Based on today's action there are several things to look at:

  • CNIT has entered a new trading range which it stayed in for a long period of time between early April and late May. As a result the "easy" assumption would be to say that major resistance will be felt at $3.01 (high on 5/10), with an earlier level of resistance at $2.83 (high on 4/7 and 4/25, and approached at numerous other times), and major support will be seen at $2.32-2.33. If the stock continues to show strength tomorrow, I believe it will confirm a higher level of support around $2.50-2.55 as well, as this served as a strong support level for pretty much all of May.
  • The stock is now well above the 50dma, and on its way to the 100dma, which stands today at $2.91. More importantly, however, we should soon see an upward reversal in the 50dma. If some consolidation happens at this range, with only little strength we could soon witness a crossover of the 50dma over the 100dma which would be a great bullish signal for the stock.
  • Volume today was splendid, with 1.17M shares traded. As I mentioned yesterday, continued strength in volume is necessary for CNIT to continue showing strength. The volume indicates particular interest in boosting the stock, and also diminishes the interest of CNIT to short-sellers (which are still numerous for these kinds of stocks). Growing momentum in volume is also a bullish sign.


While I'm at it, I also wanted to add a note about yesterday's news item regarding the Hunan Province hospital system. In this Seeking Alpha article, Alex Shadunsky attributes yesterday's gains to this win, and explains that, as the Hunan Department of Health has chosen CNIT's DHIS (digital hospital information systems) for use throughout the entire province, it greatly increases CNIT's coverage and presence in China. I believe that this fundamental piece of news, alongside the undervalued quality of the stock and the strong bullish technical indicators are jointly to thank for the recent upswing.

Recent headlines:

In good company

According to this article, CNIT has the 10th highest Return on Assets in the Software segment. Not sure if this is an exhaustive study, but the list does show some big names (e.g.: Microsoft and Oracle are 2nd and 9th, respectively), putting CNIT in very good company.

China Raises Interest Rates

The People's Bank of China (PBOC - China's central bank) just announced that they are raising interest rates b 0.25%, from 3.25% to 3.50%. In addition, the yuan lending rate is increasing to 6.56% from 6.31%. Source: Wall Street Journal.

It's yet to be seen whether this will affect CNIT and other Chinese stocks in any significant way, though US futures were down this morning. In my watchlist of Chinese stocks, which holds a variety of small, less known companies as well as several popular, larger stocks, the effect seems mixed so far. Notably, SINA, SOHU, and BIDU are down this morning. CNIT, so far, is holding up quite well, up ~3% early into the session.

Tuesday, July 5, 2011

7/5/11: $2.38

+0.25 (11.74%)


Today was a great day for CNIT. As mentioned in the previous post, it broke through the 50dma ($2.28) and up to a resistance area at around $2.40. The daily chart is below. We can see that it consolidated for a about 2 hours before dropping back to about $2.28 where it met a newfound support. At this point I longed 5,000 more shares expecting it to run back up later in the day, which it did.


The new area of resistance is a very key and strong range, where CNIT traded from April to late May. I expect that, over a number of trading sessions (could be days or could be weeks), CNIT will trade from $2.40 to about $2.60. Similar to the way it traded from ~$1.85 to $2.05 between close on June 8 up until it started showing strength on June 30 before breaking today, it could in theory stay within this new range for the month of July.

Several factors may accelerate a continuation, including but not limited to:

  • Strength in volume over the next few sessions (today was just over 500k, which is so-so; note however that in its run up from the high $4s to high $6s back in October, it picked up volume but began with days with considerably less volume than today's)
  • Continued strength in the overall market will help boost CNIT further and confirm technical strength
  • A positive centerline crossover of the MACD on the daily chart, which is likely to happen soon, may give increased technical strength
A couple of things could slow the uptrend (though it is unlikely to reverse back into weakness at this time):
  • On the daily RSI chart, CNIT is bordering on overbought - this may slow the uptrend or cause it to enter a new period of consolidation as mentioned earlier
  • Weakness in the overall market or in Chinese stocks may spill over into CNIT; Chinese stocks have been doing particularly well in the past couple of weeks, so if this slows we could also see some weakness for CNIT
As mentioned above, I longed an additional 5,000 shares today, and I've set a limit sell order at $2.49 for that lot as my guess is we'll see some volatility in the $2.35 to $2.55 range for a few trading sessions. In the event that the stock retests $2.28, I've also set a limit buy order at that level for 5,000 shares.

Can't wait for tomorrow's session!

Recent headlines:

Break through 50dma

After running up to the 50dma around 11am, CNIT slows and then comes back to break right through $2.28 at 12:20. Now it has stalled at a key resistance area, which is right around a trading range it stayed in from early April to late May, before it saw that dramatic fall on May 27. Expect it to stay around this range for a little while, though if it picks up more steam it could go up to just under $3.

More later.

Friday, July 1, 2011

7/1/11: $2.13

+0.05 (2.40%)


For the first post with analysis, I'd like to take a look at the technicals on CNIT. I use StockCharts to do my analysis. It's a fantastic tool which allows for a lot of flexibility.

Let's take a look at the daily chart on CNIT. Since this is my first chart, I won't annotate it just yet. Maybe on Monday or Tuesday.

Click the image to see a larger version of the chart.

The immediate thing you'll notice by looking at the chart is that it clearly hasn't been favored very highly on Wall Street in the past 8 months. After a rally in October 2010 that saw CNIT rise from around $4.6 to a high of $6.78, the stock (as with many other small cap Chinese stocks) has gone all the way down to, at one point, a low of $1.40. I've been in and out of the stock since mid March 2011, and am up on only long positions. The primary reason for that is that, in early June when the stock fell to $2 and then $1.50, I quickly grabbed lots of shares. The primary reasons blamed for the drop was that the then CFO of the company, Ms. Jackie You Kazmerzak, resigned unexpectedly, citing she was pursuing another career opportunity. Finding this to be an insufficient reason for the stock to be so poorly treated, I jumped in at stages (during the drop) to amass around 40,000 shares. When the stock rallied on June 8th, I was there to seize the gain.

At this point, there are technical reasons to believe that CNIT's downtrend has reversed and it is now forming an uptrend which will take it to new heights. The first key level will be the 50dma, which is currently at $2.28. If it can sustain some of the recent momentum, there is no reason to believe that it couldn't pass this mark mid next week, after which it will need to stand ground above the 50dma to consider a move to $2.95, the current 100dma.

Why this blog?

I'm starting this blog to methodically follow a particular Chinese growth stock which I believe has the potential to grow 200-300% in the next year. China Information Technology, Inc. (henceforth referred to by their ticker symbol, CNIT), is a small cap Chinese stock listed on the Nasdaq stock exchange. The current stock price, as of market close on 7/1, is $2.12, with 166,788 shares traded on this day. Its market cap is just about $111M and there are a little over 52M shares outstanding (check info on Nasdaq).

Who's CNIT? CNIT, in their own words, "specializes in Geographic Information System (GIS), digital public security and hospital information systems, with the goal of becoming the largest GIS software provider in China. Their mission, quite simply, is to "Build an information society and construct a Digital China." Considering the incredible growth of a variety of industries (including tech) in China, that's not a bad mission to have. They have an English site for you to get deeper information if you're interested: http://www.chinacnit.com/index.php.

Why CNIT? Why not RENN, SINA, DANG, BIDU, or any other highly publicized Chinese stock that investors and traders are raving about these days? Don't get me wrong, those are potentially great investments or trades as well. I actually occasionally swing trade on them, though I'm not particularly fond of what I feel are more speculative trades on companies with negative earnings or extremely high P/Es. I did actually hold SINA from early March 2011 (in the mid $80s) to about $110, before selling. But in my portfolio only about 10-20% goes towards trading on stocks that I feel are speculative in nature. CNIT is very different. They have a rock solid business model, a strong management team, an extremely low P/E (as of today it's just over 3, for a company in an industry where you wouldn't be surprised to see P/Es of 30), and it's in an environment where it has high chances of seeing extreme growth.

The stock is highly rated by anyone who cares to look (currently the only analyst I have found who is monitoring the stock, however, is Rodman & Renshaw, who set their last target at $9.00 on 4/14/2011 with a reiteration rating of "Outperform". As of today, that's over 300% upside. But of course it doesn't always work that easily. However, I'll follow the stock with this blog, carefully monitoring fundamentals as well as technicals, and hopefully make lots and lots of money.

Recent headlines:
- China Information Technology: Stock to Watch: Up 4.9% (CNIT)
- Crystal Gazing Tech Winners: NTWK, OPWV, CNIT
- A Little Rise, a Little Trend? BLDP, CNIT, FTWR, TRID

Disclaimer: I do not work for CNIT, nor am I connected with anyone employed there. I also do not have access to any information which is not public - i.e.: I have the exact same information that you do. I just pay attention to it more for this particular stock :)